
Hallucinations in AI Analytics: still real and dangerous
I'm shell-shocked by AI hallucinations from our most recent Chart Chat

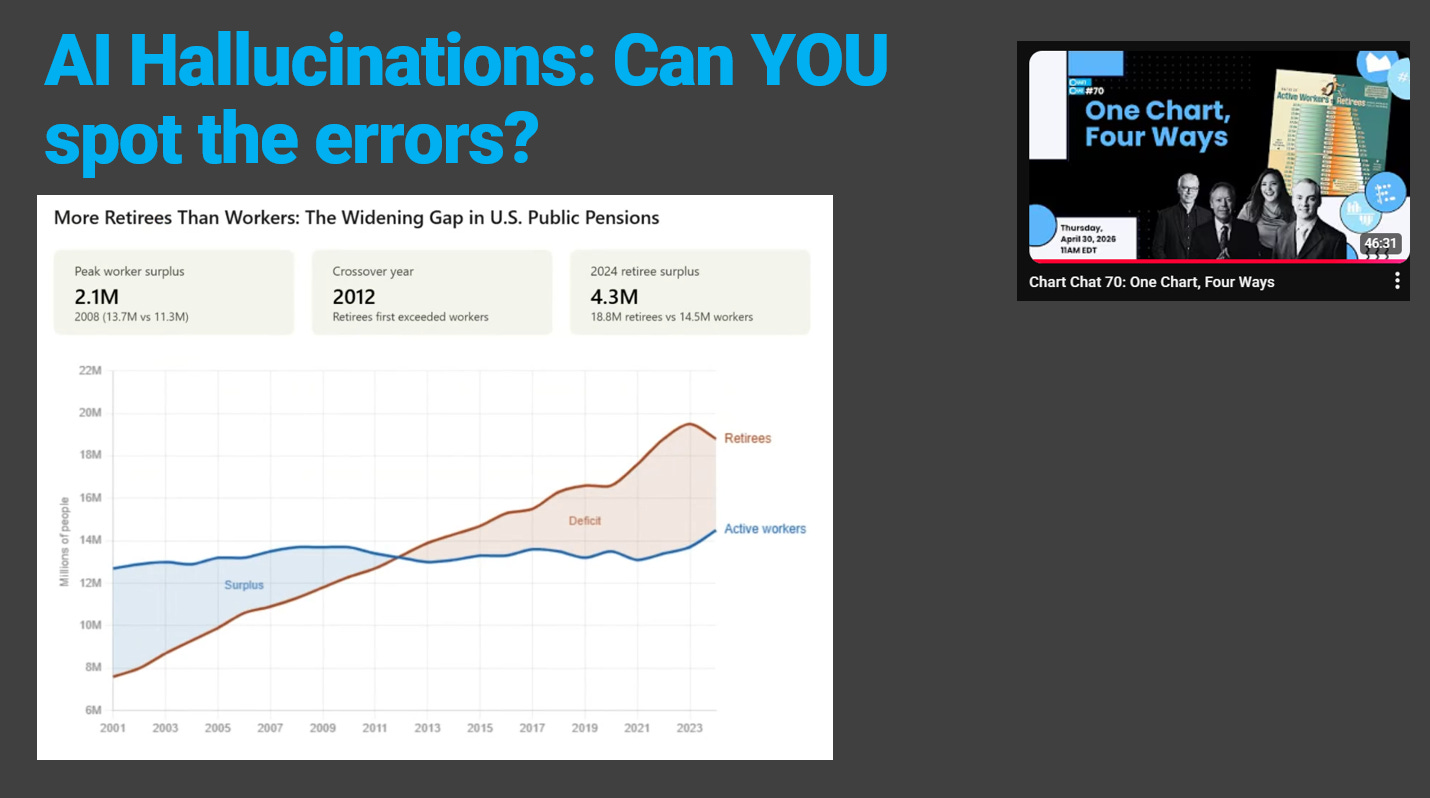
It’s too easy to be wowed by AI Analytics and miss mistakes. Mistakes that then propagate through to incorrect decision-making.
Our latest Chart Chat episode highlighted how even seasoned professionals get carried away. My trust in AI Analytics had been rebuilding after a previous heinous error (see below), but I admit, this has really set me back. I’m back to Very Wary mode.
Can you spot the error?
It was a “One Chart, Four Different Ways” episode. Steve, Jeff, Amanda and I were all remaking a chart about active workers and retirees from Voronoi. Three of us used AI Assistants to remake our chart.
Steve used Claude Code to build an attractive dashboard with BANs. Through several versions, ending up with the image below as his final makeover.
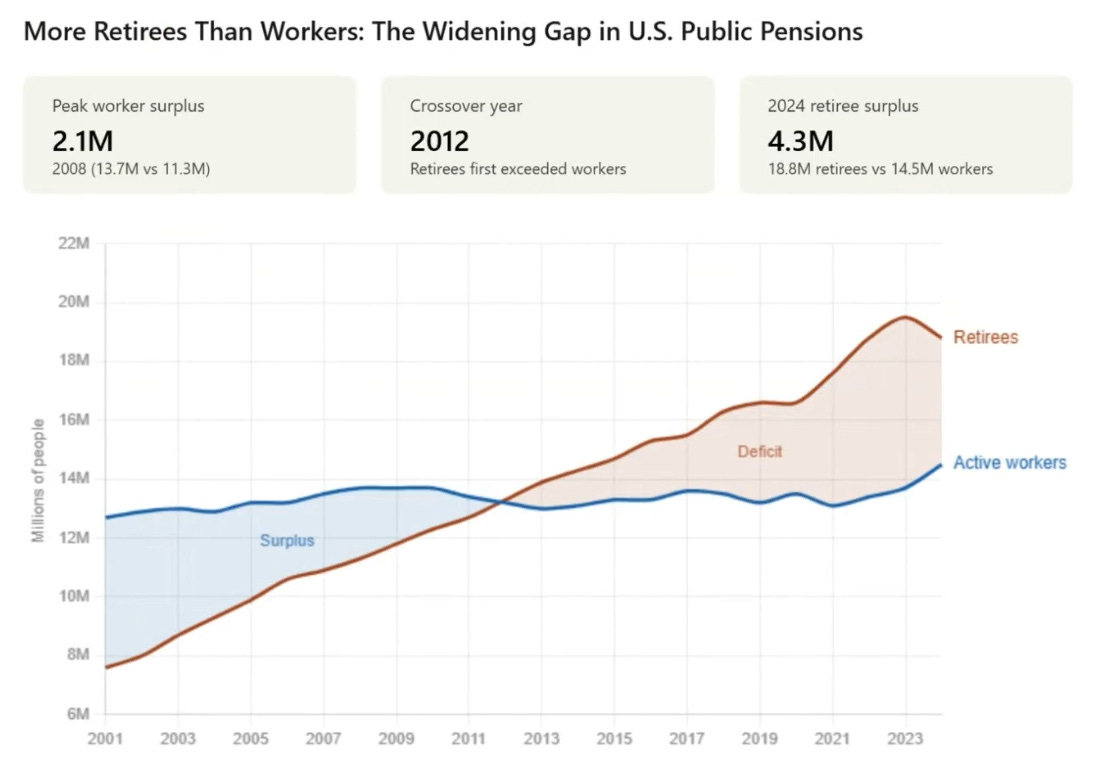
It’s lovely. In our episode, we discussed how impressed we were with Claude.
After every episode of Chart Chat (do go subscribe to our newsletter!) we have an “After Party” - an open invite Zoom where attendees can share their conversation. After this episode, BJ Price explained how she is still concerned about hallucinations. Someone then asked, “Steve, are you sure your version didn’t contain errors?”
A quick check, and Steve realised that the Peak Worker Surplus calculation was wrong:
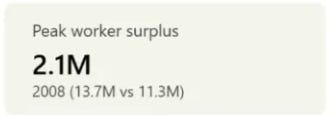
Claude had indeed made an error. The surplus in 2008 was 2.4 million.
In each iteration Steve made, the error was passed on. Wowed by the attractive styling, neither he nor us spotted it.
But there’s an even bigger error we didn’t spot
In writing this post, I now see an even bigger error. It’s even more obvious than the subtraction error and none of us spotted it in the building of the viz, during Chart Chat, or during the After Party.
Look again at the chart. When is the “peak worker surplus”? (i.e., when is the gap between the blue and red lines the highest?)
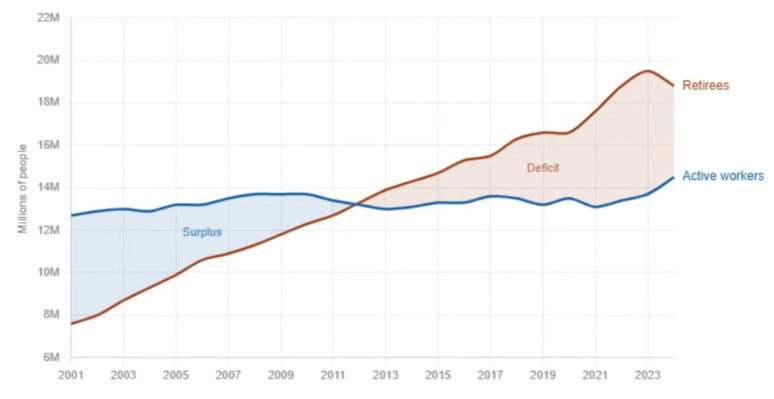
Claude’s BAN claimed the peak was 2008. It’s clearly not: it’s 2001. (5.1 million)
I’m really shocked. Shocked at our inability to spot this.
Imagine doing this for real data. You do the work and share your insights. Decisions get made based on 2008 not 2001. Errors like that could easily be very expensive.
What happened under the hood?

The BANs were hard-coded in the HTML. It’s not clear where Claude made the mistake, but once that hallucination was on the dashboard, the mistake was permanent.
I thought we’d got past this
I’m building an “AI for Data Analysts” course (details soon) and had been using an old example of hallucinations that happened in ChatGPT 4.
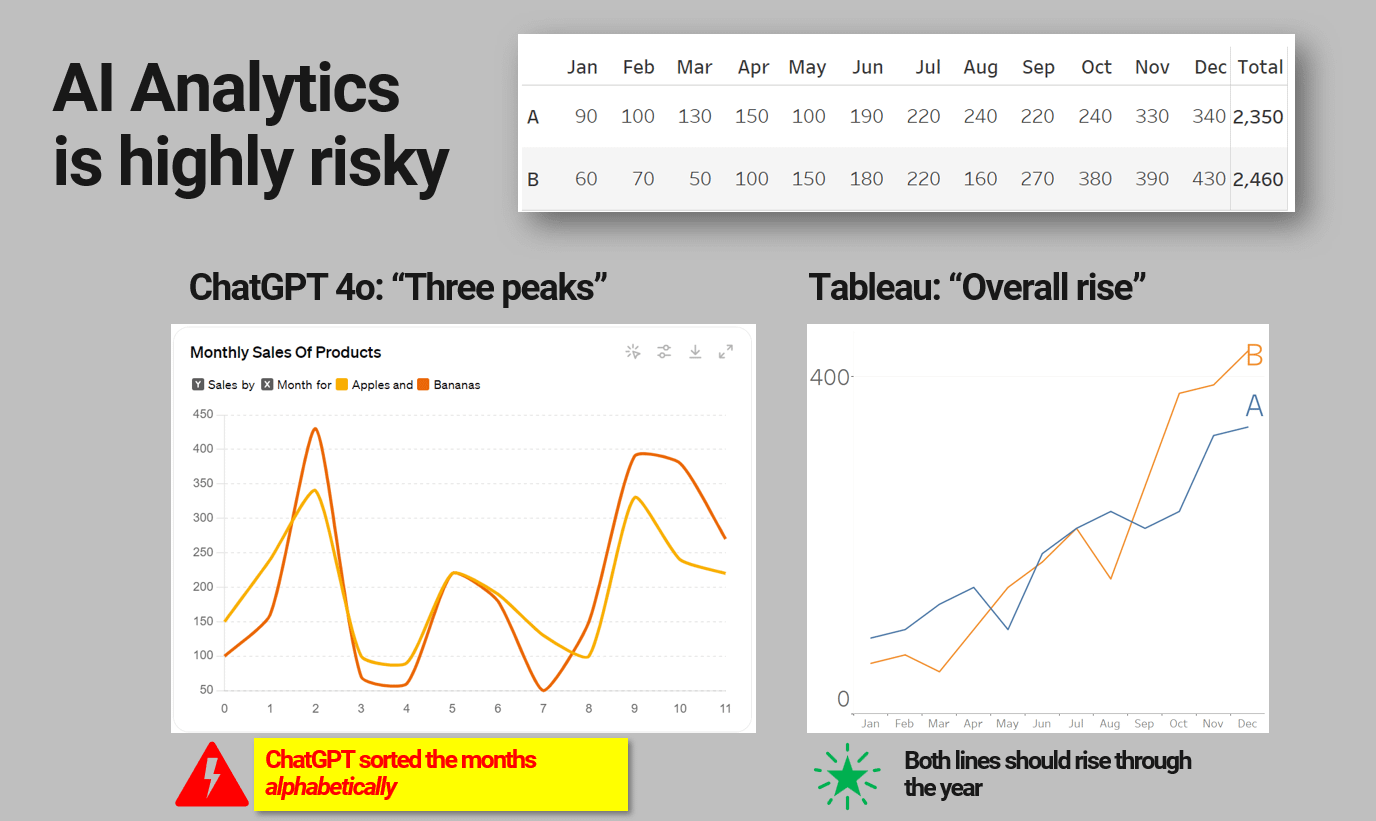
In this case, when I’d asked ChatGPT for a chart based on a really simple dataset, it created a line chart with the months sorted alphabetically. To make it worse, ChatGPT labelled the x-axis with the numbers 1-12, further hiding the error. I only caught it because it was a fake dataset and I knew it should show sales going up.
My course contact said we can drop the section on hallucination because the ChatGPT 4 option is old, and the models have gotten so much better since then.
I agreed with him. We dropped it.
Now I have a new example proving we cannot drop the hallucination risk section.
What do we do?
I’m somewhat shell-shocked this morning. I have been increasingly gung-ho about AI-driven analytics. I am shaken by seeing a glaring error that none of us spotted. And in seeing Steve talk through the iterations he took, he’s representing the work any one of us could do: iterate through a solution, without deeply checking every result.
What’s the solution? Manually test every number? Ditch the AI Analytics?
I’m honestly not sure. We’re all trying to work harder and faster. How do we make time to check everything?
What do you think? Are you checking all your numbers? Are you seeing hallucinations?
Before you go, here’s a quick plug for Dashboards That Deliver. Right now, it’s at a steeply discounted price (60% off) on Amazon UK and the US. If you’ve been on the fence about buying it, now’s your chance!

Thank you for the write-up, Andy. I am still seeing hallucinations in different places. Gemini, Claude, any model. They're not behind us. I actually spot a nonsensical sentence maybe once a day in the AI answers of Google searches. Analytics is such a tough nut to crack for AI, because analytics is all about making decisions based on facts and math. I think we shouldn't ask AI "produce an analytic". You've gone down that path and we see the limitations. We should ask AI "produce the math that produces numbers that answers my question", and "explain why you took this mathematical approach for my business question". If you like the logic, you ask AI to apply the math to the raw numbers, and to format the output (without any further data transformation). There is still the possibility that the math and the math narrative don't match - but that's almost a coding problem, and I do trust models with coding tasks.
Hi, Andy. I was there at the After Party and really enjoyed the Chart Chat as well as your Substack posts so I was all ready to start using Claude rather than spend more with Tableau. Now I’m not so sure. In the early days of spreadsheets I used to create formulas to double-check the calculations since spreadsheets were new and I didn’t trust them. I no longer do that, of course, but maybe it’s time to build in some self-check audits for AI. Could we ask ChatGPT, Gemini or another AI to check Claude’s work?